Zoom Phone Power Pack is an enhanced license that offers Call queue Real-time analytics & Historical reports, and provides access to the User Performance reports.
Content
- Analytics & Reports Login
- Real-time Analytics
- Historical Reports
- User Performance Reports
- Manage Active Members
- Opt-out Codes
Analytics & Reports Login
To log in to the dashboard:
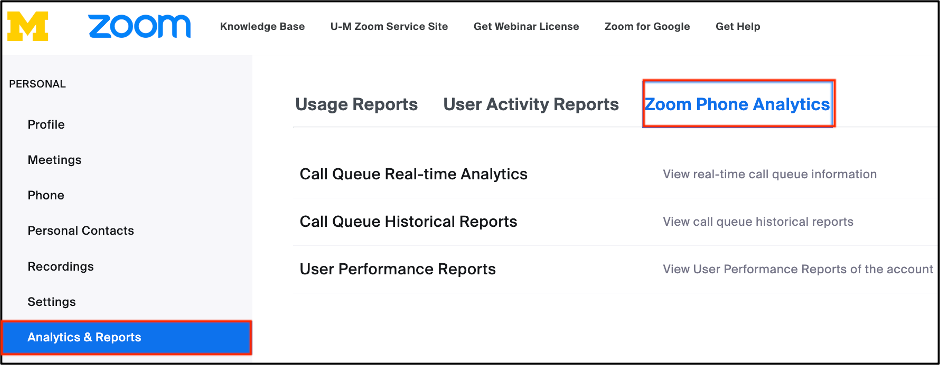
- Sign in to the U-M Zoom web portal with your U-M Credentials.
- In the left navigation menu, click Analytics & Reports.
- Click Zoom Phone Analytics.
Real-time Analytics Dashboard
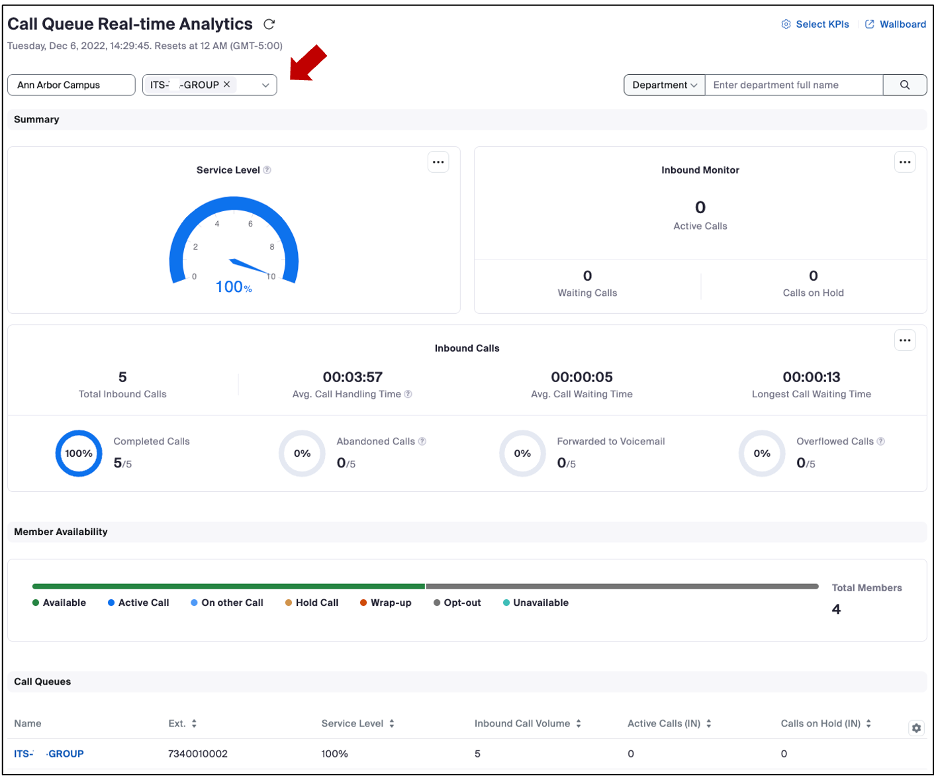
Call queue real-time analytics dashboard provides critical details such as:
- Service levels
- Call handling and wait times
- Call volume counts
- Queue Statistics- Average/longest wait time, Completed/abandoned/ missed call counts and more.
To view a customized data in your call queue real-time analytics:
- Click Call Queue Real-time Analytics and select a site (Ann Arbor, Flint or Dearborn Campus) and a call queue using the drop-down menu at the top to view data from a specific site or a specific call queue.
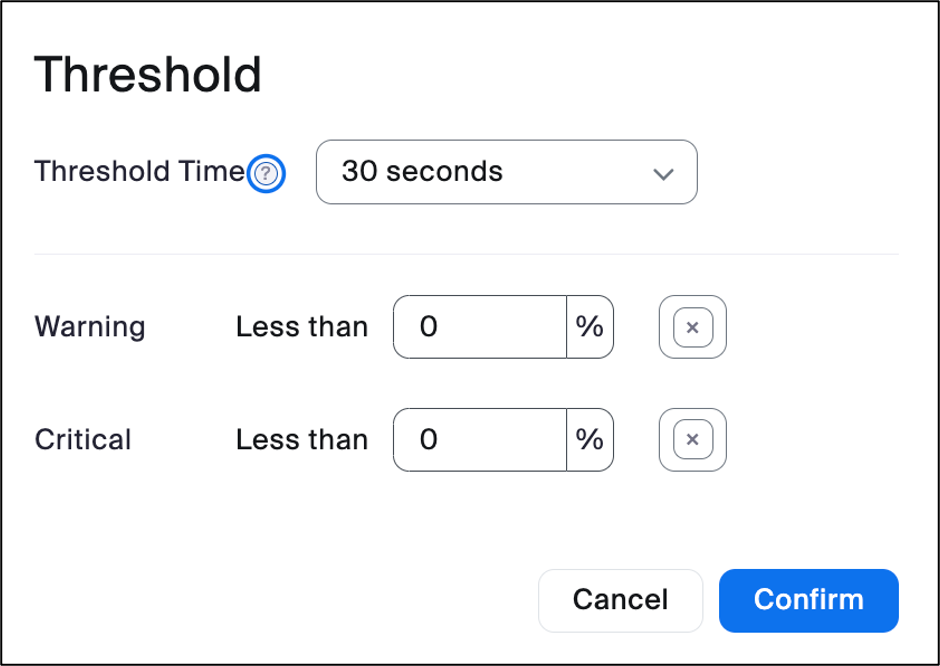
- Click the ellipses icon (...) in the top-right corner of the Service Level area or other widgets to apply specific Service level thresholds.
- Click the settings icon
 and Select KPIs in the top-right corner to add additional data columns for KPIs.
 - For the wallboard, hover over the top-left corner of which widget, then drag and drop to customize the position of each widget.
Historical Reports
Call queue historical dashboard is part of the Power Pack add-on. Data for historical call queue can be seen and exported within 30 minutes after receiving a call. You can select a date range of up to 2 years for you historical reports. Click Call Queue Historical Reports to view and customize the following reports:
Chart Report
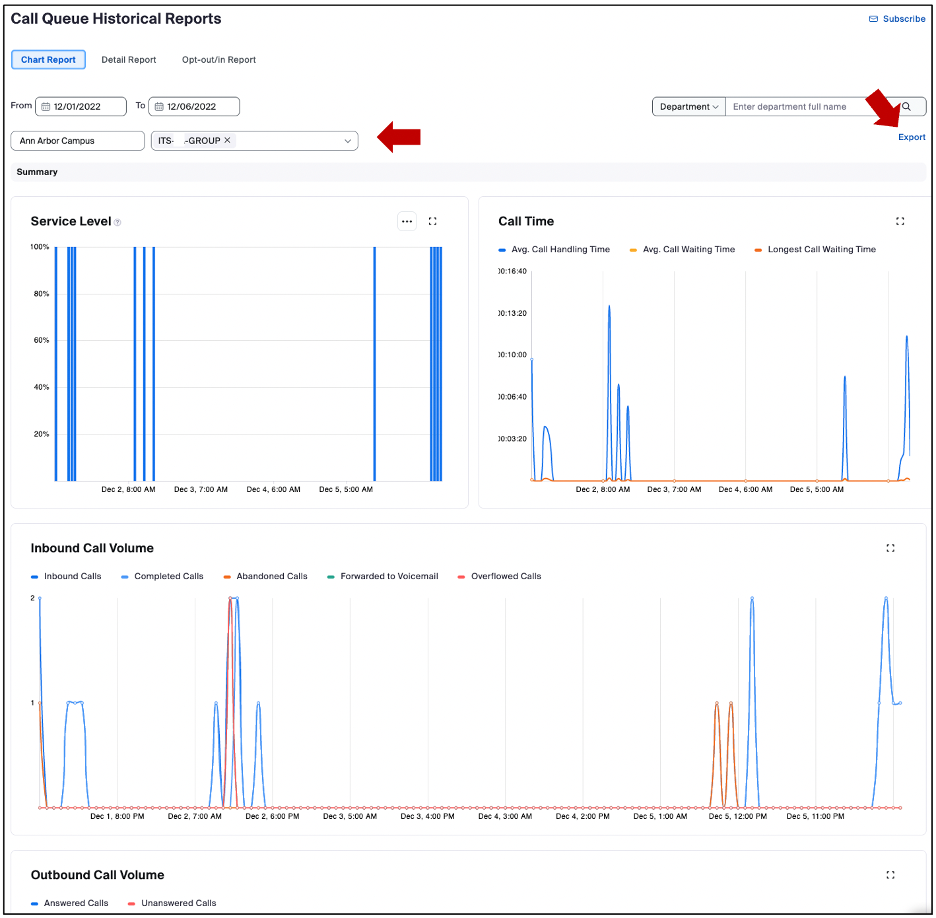
Use the following options to filter or customize the data in the Chart Report :
- Select the site (Ann Arbor, Flint or Dearborn Campus) and call queue using the drop-down menus at the top to only view data from a specific site or call queue.
- Click Export to export data to a CSV file.
- Click the ellipses icon (...) in the top-right corner of certain widgets to apply specifc service level thresholds.
Detail Report
Use the following options to view and customize the data in the Detail report.
- Select the site (Ann Arbor, Flint or Dearborn Campus) and call queue using the drop-down menus at the top to only view data from a specific site or call queue.
- Click Export to export data to a CSV file.
- Click Details in the last column to view more details about the call.

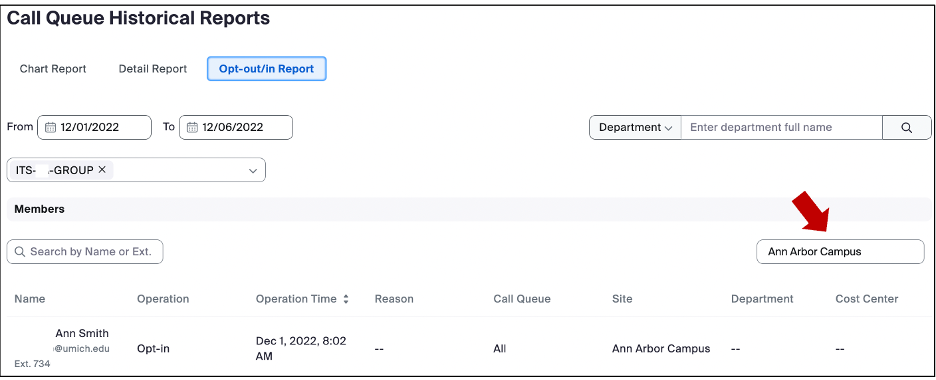
Opt-out/In Report
Use the following to view and customize the Opt-Out/In report:
- In the From and To box calendars, select a date range.
- In the Call Queues (All) drop-down menu, select a specific call queue or all call queues.
- In the site box, select a specific site or all to view its opt-out report.
User Performance Reports
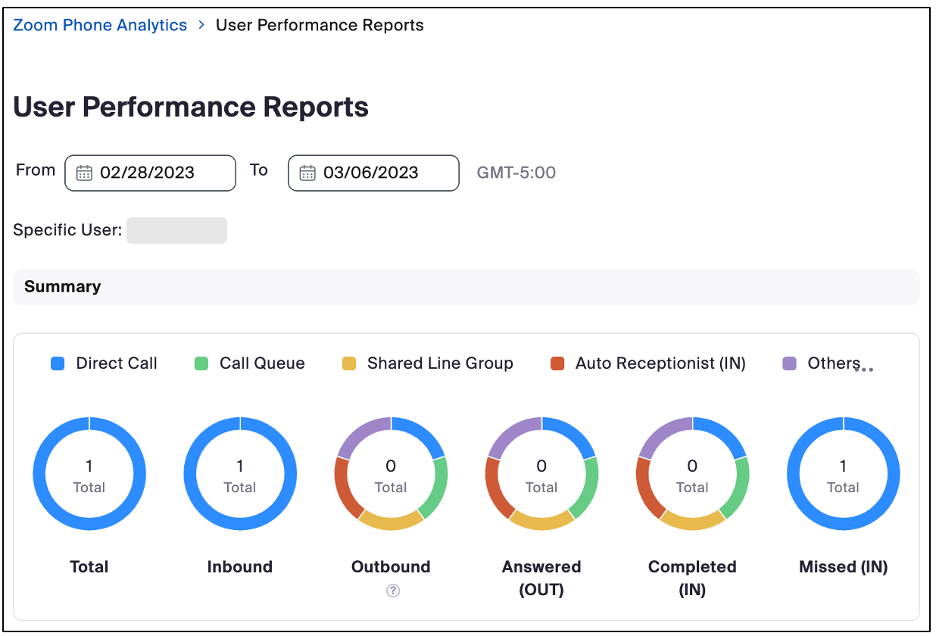
User Performance reports is part of the Power Pack add-on that allow you to view the performance data of each user. As an admin, you can view the average number of inbound and outbound calls for a group of users on a daily, and weekly basis, as well as missed calls, and calls answered by others.
Manage Active Members
The Call Queue admin can turn on/off active members remotely through the U-M Zoom web portal.
- Sign in to the U-M Zoom web portal with your U-M Credentials.
- In the left navigation menu, click Analytics & Reports.
- Click Zoom Phone Analytics.
- Call Queue Real-time Analytics
- CQ admin can toggle on/off Receive Queue Call to manage queue members.

Opt-out Codes
Admin with Power pack license can configure opt-out reason codes through the U-M Zoom web portal as well. to do that:
- In the navigation menu, click Phone System Management then Call Queues.
- Click the name of the call queue you want to edit.
- Click the Policy tab.
- Click the Call Queue Opt-out Reason toggle to enable or disable it.

5. Once the opt-out reason codes are available, the CQ admin can toggle opt-in/out for queue members- from the Call Queue Real-time Analytics.
