
Content
To provide the best customer service, Amazon Connect allows you to generate real-time metrics, historical metrics, and login/logout reports.
Real-Time Metrics Reports
Real-time metrics reports show real-time or near-real time metrics information about activity in your contact center. Metrics such as the number of agents currently online in real-time (updating every 15 seconds), agent’s availability, calls currently in the queue, number of callback contacts, and number of calls handled the queue.
To Create a real-time metrics report:
- Log in to Amazon Connect at U-M
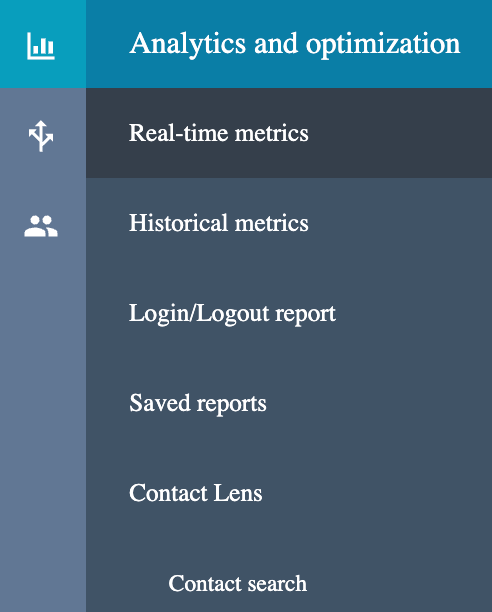
- Choose Analytics and optimization, then Real-time metrics.
- Choose one of the following report types.
- Queues
- Agents
- Routing profiles
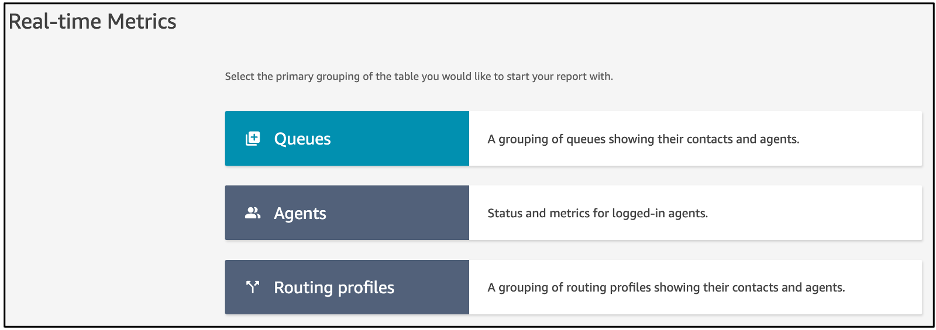
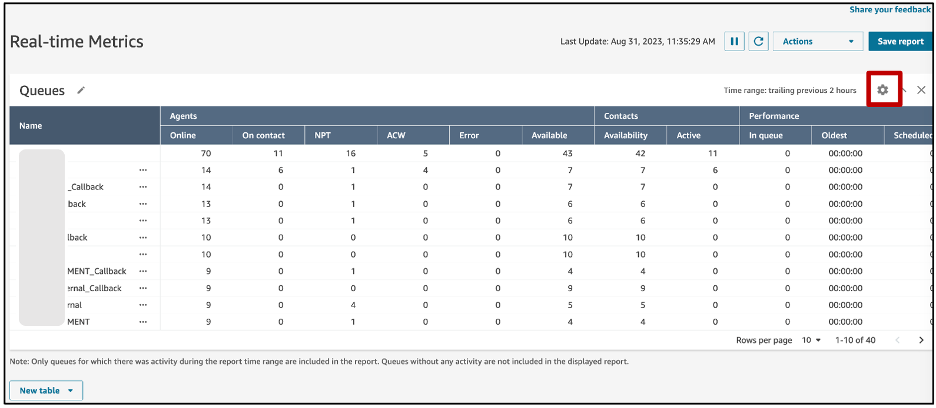
- For example, select Queues. To customize a report, choose the gear icon from its table.
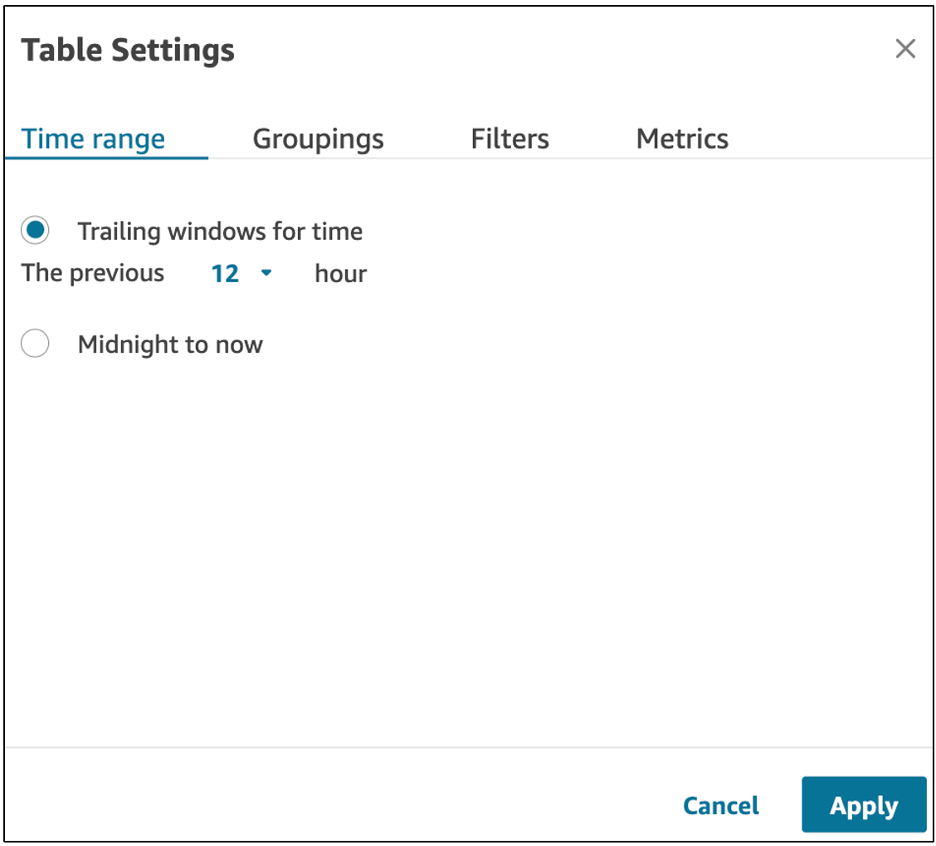
- Customize the Table Settings:
- On the Time Range tab , from Trailing windows for time, select the time range, in hours, for the data to include in the report. (12 hrs time range is one of the most common time range used by supervisors). If you select Midnight to now, the time range is from midnight to the current time, based on the Time Zone that you select.
- (Optional) On Groupings tab, determine how the data is aggregated in the rows of your table.
- (Optional) On the Filters tab, specify filters to scope the data to be included in the report. The available filters depend on the report type. Possible filters for Queues could be: Queues, Routing profiles and Channels.
- (Optional) On the Metrics tab, choose the metrics and fields to include in the report. The available metrics and fields depend on the report type and filters that you select.
- When you are finished customizing the report, choose Apply.
- To save your report for future reference, choose Save, provide a name for the report, and then choose Save

- (Optional) To add another report to the page, choose New table at the bottom of the screen and then choose a report type. You can add multiple reports of the same report type.

Historical Metrics Reports
Historical metrics reports include data about past, completed activity and performance in your contact center. Metrics to include in the historical reports might include information Contact record-driven metrics or Agent activity-driven metrics.
To Create Historical Report:
- Log in to Amazon Connect at U-M
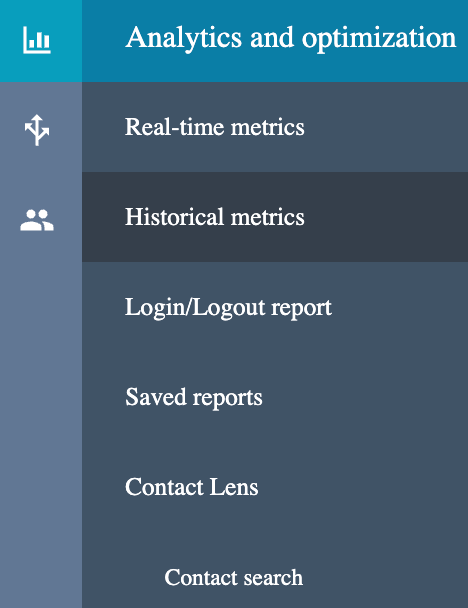
- Choose Analytics and optimization, then Historical metrics.
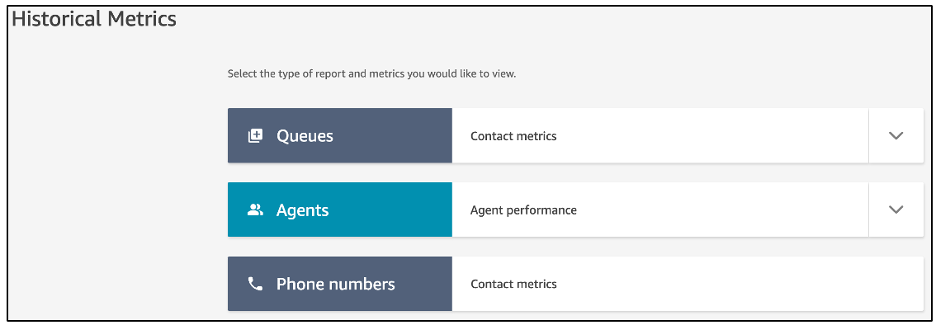
- Choose one of the following report types.
- Queues
- Agents
- Routing profiles
- Choose the gear icon to customize your report. Select the desired Time range, Groupings, Filters and Metrics to include in your reports.
- When you are finished customizing your report, choose Apply.
- (Optional) click Save Report, and provide a name for the report, and then choose Save.
Login/Logout Report
The Login/Logout report displays the login and logout information for the users in your contact center including agents and supervisors.
To generate a Login/Logout report:
- Log in to Amazon Connect at U-M
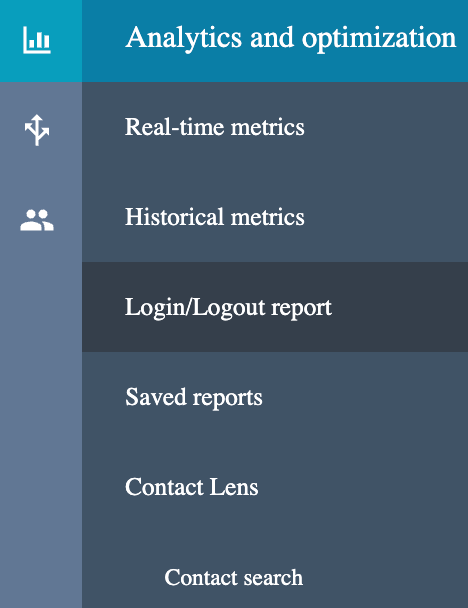
- Choose Analytics and optimization, Login/Logout report.
- On the Login/Logout report page, choose the Time range for the records to include in the report, specify the Time zone and filter data by agent, agent hierarchy, none or Routing profile.
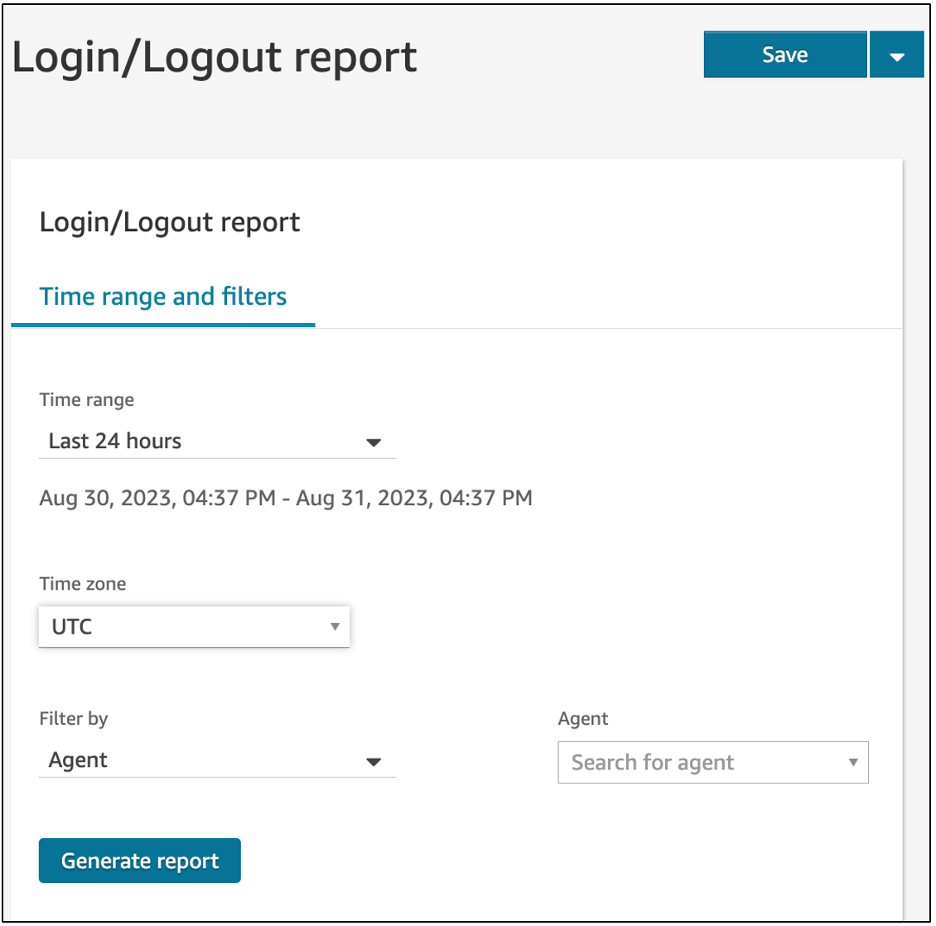
- Choose Generate report, Save.
- Provide a name for the report, and choose Save.
Actions Menu
Actions menu allows you to save reports with a new name, download reports a comma-separated value (CSV) file, schedule reports or share them with others.
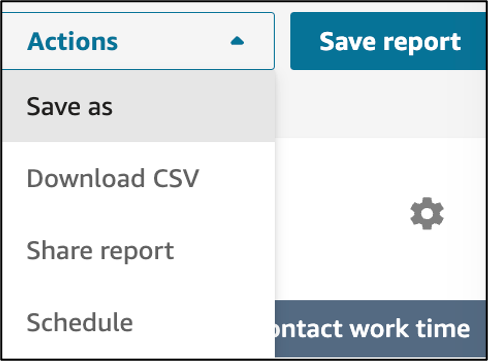
Save as a Report
- To save your report with a new name. After you created and saved the report, Click Actions in the top-right corner of the page.
- Choose Save as.
- provide a name for the report, and then choose Save.
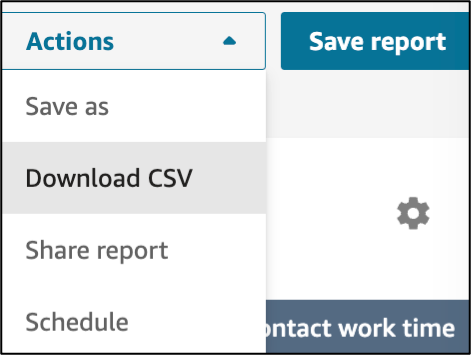
Download a Report as a CSV file
- After you created and saved the report.
- Click Actions and choose Download CSV from the down arrow.
- When prompted, confirm whether to open or save the file.
- You can open the report in Excel. All times in the downloaded report are in seconds.
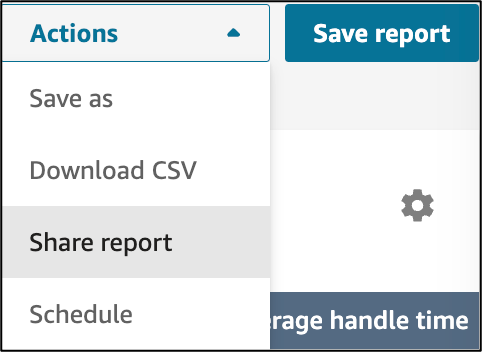
Share a Report
- After you created and saved the report.
- Click Actions and choose Share Reports from the down arrow.
- Type in the name of your report.
- Click Save.
- You will be provided with 2 options either a direct link to the report and you can publish the report and make it viewable by others. Users can use the link to get the report or they can locate it under Saved Reports.
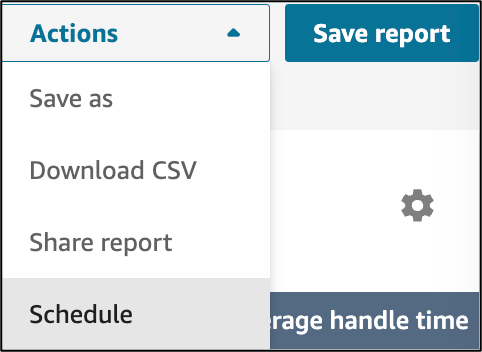
Schedule a Report
- After you created and saved the historical report.
- Click Actions and choose Schedule from the down arrow.
- Name the report and it will show a confirmation message, click Continue to proceed .
- Specify the Recurrence and Delivery Options.
- Additional information Scheduling will come soon.
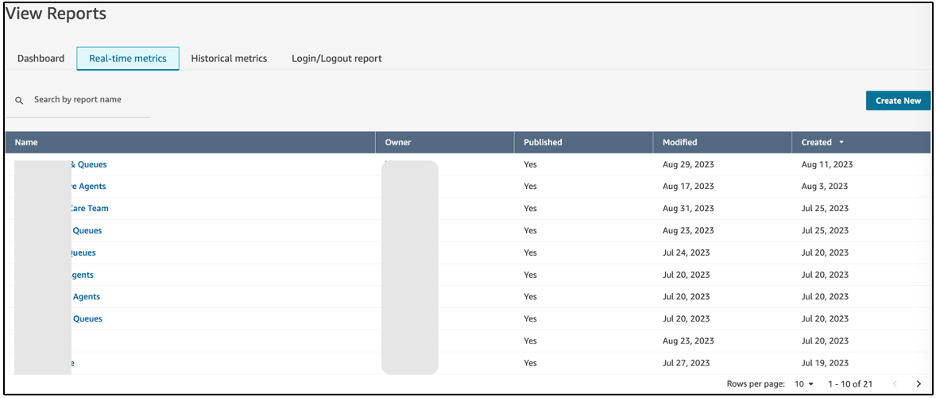
View Saved Reports
- choose Analytics and optimization, and then Saved reports,
- Choose the Real-time metrics tab or Historical Metrics tab.
- Click the report name to view it.
Learn more
- Amazon Connect: Real-time metrics definitions.
- Amazon Connect: Historical metrics definitions.
- Amazon Connect: Real-time metrics & Historical metrics reports
- [Video] Amazon Connect: How to create, save update and download real-time metric reports
- [Video] Amazon Connect: Using Historical Metrics and Reporting
- [Video] Amazon Connect: How to generate Login/Logout Reports