Introduction
This level of the enterprise system and reporting dashboard provides an overview by Dean/Director/VP area of the utilization of gift funds, identifying funds based on the definitions found in the Policy on Stewardship and Management of Gift Funds of high, moderate, and low utilization, as well as gift funds for which a PG Review Indicator has been selected and placed under review. Deans, Directors, and VPs are responsible for utilizing this dashboard to:
- Review and monitor gift fund utilization at the S/C/C/U level
- Identify areas of low, moderate, and high gift fund utilization for the S/C/C/U
- Assess progress toward high utilization at the S/C/C/U level
As stated in the Policy on Stewardship and Management of Gift Funds, the University of Michigan has a legal fiduciary obligation to respect and honor the history, relationship, and intent of a donor's gift. Effective use of gifts also enables investments in research and education, supports ongoing fundraising and donor relations, and is essential for the university to sustain long-term financial health. All expendable gifts and distributions from endowment should be used in a timely manner and must be used for purposes consistent with donor intentions, or the University risks breaching its legal fiduciary obligations as well as damaging the culture of philanthropy and the reputation of the University and its philanthropic program.
Tab Descriptions
There are three tabs found on this view, these tabs appear at the top of the dashboard, regardless of which initial view is selected:
- The Start Here tab contains definitions of utilization terms, known issues and instructions on reading the dashboard charts.
- The Deans, Directors and VP's dashboard tab contains the Gift Fund utilization data. A detailed explanation of each section follows below.
- The Methodology tab contains more detailed explanations of the utilization terms, known issues and the Project Grant (PG) Review Indicators definitions.
Dashboard Tab Overview
Filters & Views

- When selecting the Dashboard tab for the first time you will notice there is no data displayed in the Percent of Gift Fund Utilization section. You MUST select at least one filter from the Initial VP Area dropdown or the Department Group dropdown (or both) to see the desired data.
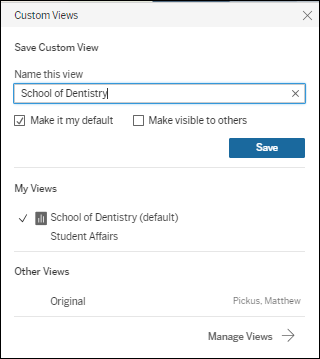
- At the top of the page, in the Tableau navigation bar, you can click on View: Original option to set a default view for quick access on return visits to the dashboard.
- Use the filter dropdown(s) to display the desired view.
- Click the View: Original link.
- The Custom Views box will open.
- Complete the Name this view text box with the desired name.
- Click the Make it my default checkbox and click Save.
- This view will now display each time you return to the dashboard. You can create as many custom views as you need.

Gift Fund Utilization Section

- Use the filters to display the desired data. Each Category will display the % of Project Grant Utilization (PGU), the $ amount of the PGU, and the # of Project Grants (PGs).
- In the dashboard banner, hover over the information icon
 to read the utilization definitions.
 - You can filter by VP Area, Department Group and Purpose Category Group using the drop-down boxes at the top of the section.
NOTE: All data is as of July 1 of the current fiscal year. As low or moderate funds are reviewed and tagged with a Project Indicator in DART, these funds will move into the Under Review category within the current FY.
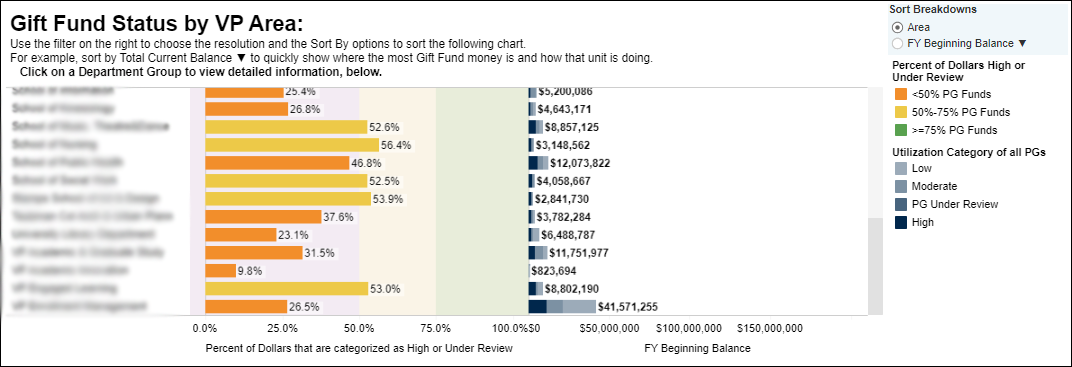
Gift Fund Status by VP Area

- The left chart displays the percentage of Project Grants that are High Utilization or Under Review; hover over graph bars for details.
Important Note: You must click on a VP Area in the left chart to populate the next section of the dashboard. - The right chart displays the utilization category of all Project Grants (high, under review, moderate, low) and is useful to see relative percentages of moderate and low categories.
- The right sidebar allows you to sort the two charts by Area or FY Beginning Balance.
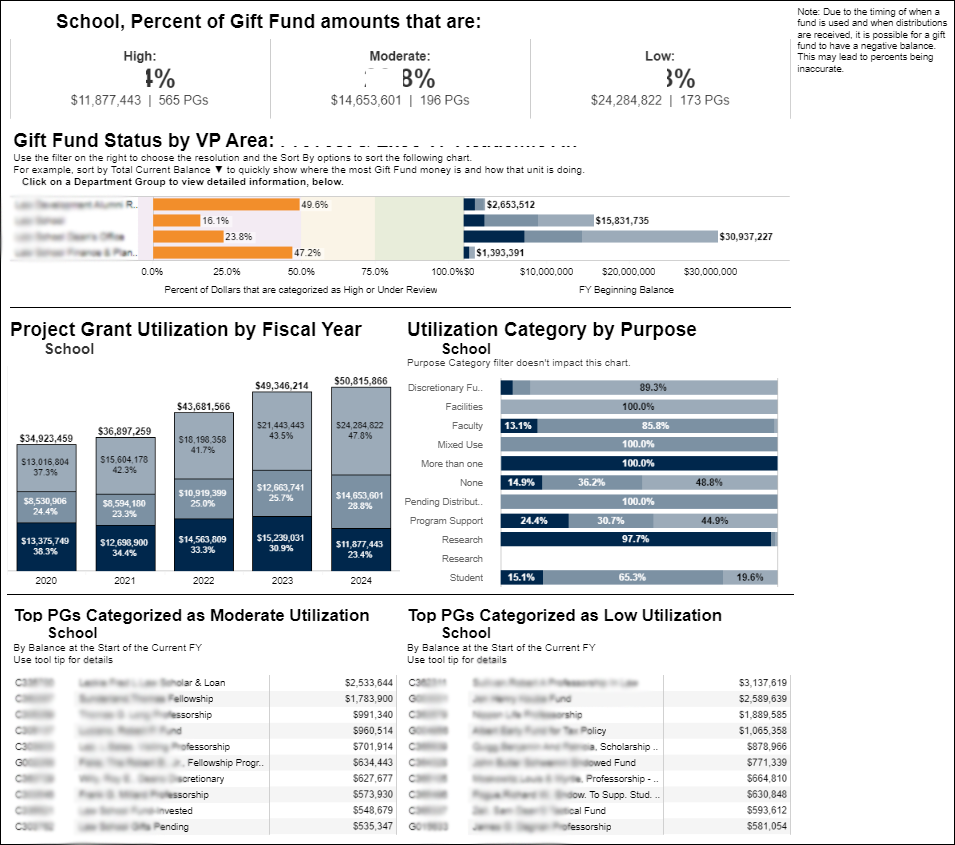
VP Area Detail Section

- This section shows details on the VP Area selected. This includes:
- Percent of Gift Funds that are High, Under Review, Moderate and Low utilization
- Gift Fund Status for each sub-group, if applicable
- Project Grant Utilization by Fiscal Year
- Utilization Category by Purpose
- Top Project Grants Categorized as Moderate Utilization (top 10 only are listed)
- Top Project Grants Categorized as Low Utilization (top 10 only are listed)
- Hovering over the various graph bars will show more details.
